
Week 12: In-Class#
Coding Practice#
Code 12.1: Smooth Curve#
A closed curve is represented using a sequence of 2D points \(\mathbf{p}_i\), \(i = 1, . . . , n\) connected by line segments, where the last point is connected to the first point. The curve is smoothed by moving every curve point \(\mathbf{p}_i\) in the direction of the average of its two neighbors. The coordinates for the smoothed curve are computed as
for \(i = 2, . . . , n−1\). For the first and last point in the curve, the smoothing is done similarly, taking into account that the curve is closed (i.e., \(\mathbf{p}_n\) is a neighbor of \(\mathbf{p}_1\), and \(\mathbf{p}_1\) is a neighbor of \(\mathbf{p}_n\)).
The parameter \(\alpha\) controls the strength of the smoothing and is usually between \(0.1\) and \(0.5\).
An example of the original and smoothed curves is shown below for \(\alpha = 0.5\).
Problem Analysis
Consider a curve with the points
and the smoothing parameter \(\alpha = 0.5\).
What are the coordinates of:
\(\mathbf{s}_2\)
\(\mathbf{s}_1\)
Demo
Write a function that takes as input a 2D numpy array of shape (2, n) containing the coordinates of the curve and a scalar \(\alpha\). The function should return a 2D array of the same shape as the input, containing the smoothed points.
Test your function by plotting the original curve and the smoothed curve and compare your plot with the illustration below.
>>> P = np.array([[24, 40, 36, 44, 28, 18, 12, 0,  8,  4],
...               [12, 16,  8,  4,  0,  4,  0, 4, 12, 16]])
>>> smooth_curve(P, 0.5)
array([[23. , 35. , 39. , 38. , 29.5, 19. , 10.5,  5. ,  5. , 10. ],
       [14. , 13. ,  9. ,  4. ,  2. ,  2. ,  2. ,  5. , 11. , 14. ]])
smooth_curve.pysmooth_curve(P, alpha)
Compute the smoothed curve
Parameters:
|
|
A numpy array of shape (2, n) containing the points of a curve. (n>=3) |
|
|
The smoothing parameter. |
Returns:
|
A numpy array of shape (2, n) containing the smoothed curve |
You can also use the following script to check your function test_smooth_curve.py. If your function fails the test in this script, it would also fail if you could hand it in.
Code 12.2: Powers of 2#
In Code 6.4: Powers of 2 you wrote code which created a list with the first n powers of 2. Let’s write code to do the same, but in a single line, using NumPy.
You should write code that uses an integer n computes a NumPy array of the first n powers of 2. For example, for n = 4 the array should contain the values \(2^1\), \(2^2\), \(2^3\), \(2^4\), so the array should be [2, 4, 8, 16]. Test your code with n=1, n=4 and n=10.
Hint
You need to make an array which contains the exponents [1, 2, 3, …, n]. Then use the power operator **. It works element-wise, so even if the base is a scalar (a single number), the output will be an array!
Code 12.3: Months with More than d Days#
You are given the following Numpy arrays.
months = np.array(['Jan', 'Feb', 'Mar', 'Apr', 'May', 'Jun', 'Jul','Aug', 'Sep', 'Oct', 'Nov', 'Dec'])
days = np.array([31, 28, 31, 30, 31, 30, 31, 31, 30, 31, 30, 31])
You should write a code that given a number d creates a new NumPy array, months_with_more_than_d_days, containing the names of all months that have more than d days. For example, for d = 30, the array should contain:
['Jan' 'Mar' 'May' 'Jul' 'Aug' 'Oct' 'Dec']
Try it also for d = 31 and confirm that the array is empty.
Hint
Compare days with d using an inequality to create a boolean array. Then use logical indexing on months.
Code 12.4: Math Functions#
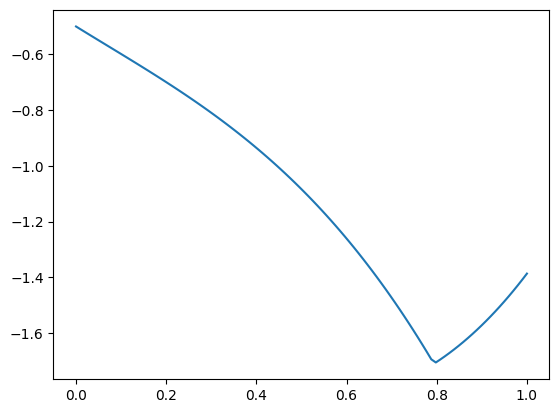
We want to plot the function:
on an n equally spaced points in the interval \([0,1]\).
To solve the problem, you should:
Define an integer
n, for examplen=100.Create a Numpy array
x, containing linearly spaced points between \(0\) and \(1\) (including both \(0\) and \(1\)).Write an expression for the function \(f(x)\), and call it
y.Use Matplotlib to plot the values of line consisting of the points \((x, y)\). Your plot should look like the one shown below.
Hint
NumPy has a function that creates an array of equally spaced points between two values. Numpy has also functions for the square root, sine, exponential, power, and absolute value. You can use them to calculate the function \(f(x)\).
Code 12.5: Counting Integers#
In the previous weeks, you have been counting how often different letters and numbers appear in lists. In this exercise, you will combine functions and NumPy to calculate the frequency of a specific integer in a NumPy array.
Start by making a function count_number(array, integer) with two inputs. The first input array should be a NumPy array of integers and the second input integer should be an integer. Your function count_number should count the number of times integer appears in array.
Test the function by defining array = np.array([3, 5, 2, 3, 3, 5, 6, 9]), and checking that count_number(array, integer) gives the correct output for different integers.
Hint
Test for equality with == between array and integer. Use np.sum to count the number of True values.
Make another function, array_frequencies that counts the number of times all integers between 0 and 9 occurs in the array. The function should take as input a NumPy array of integers between 0 and 9, and output a NumPy array of integers of length 10 with the frequencies of each number between 0 and 9 in the input.
Check your function by printing array_frequencies(array). You should get
[0 0 1 3 0 2 1 0 0 1]
Hint
Preallocate the output array and make a for loop over the integers from 0 to 9. Remember to preallocate the array of integers such that the datatype is int.
To see how to solve this problem using a specific NumPy function, take a look at Advanced 12.4: Counting Integers.
Problem Solving#
Problem 12.6: Is the CPR Number Valid?#
Have you ever wondered how websites know if the CPR number (the Danish civil registration number) is valid or not? In this exercise, you will find out how to do this yourself!
The last digit of the CPR number is a check digit, which is calculated from the first nine digits. This can be used to check the validity of a CPR number.
Let’s say you are given the CPR number 1111111111 and you want to know whether it is valid. Here is how you can check it:
Multiply the first nine digits by the corresponding value from the “control number” 432765432, and add the results together. In our example, since the first nine digits of the CPR number are
111111111, this should give
Calculate the remainder when dividing the previous result by \(11\). In our case, this is 3 since \(36 = 3\cdot 11 + 3\).
Subtract the remainder from 11 to get the check digit. In our case that would be \(11-3=8\).
The final digit of the CPR having first nine digits
111111111should therefore be \(8\). So1111111118is a valid CPR number. But you were given1111111111which ends with \(1\), and not \(8\). So1111111111is not a valid CPR number. That’s it!
Write a function that takes a Numpy array of CPR digits as input and returns a boolean value indicating whether the CPR number is valid or not.
cpr_check.pycpr_check(array)
Checks if a CPR number is valid or not
Parameters:
|
|
A numpy array of shape (10,) containing the digits of a CPR number |
Returns:
|
A boolian variable which is True if the CPR is valid |
You can test your function, by verifying the following (randomly chosen) cases:
Check
>>> cpr_check(np.array([1, 1, 1, 1, 1, 1, 1, 1, 1, 1]))
False
>>> cpr_check(np.array([1, 1, 1, 1, 1, 1, 1, 1, 1, 8]))
True
>>> cpr_check(np.array([1, 0, 0, 9, 7, 8, 5, 2, 4, 4]))
True
>>> cpr_check(np.array([1, 2, 1, 2, 0, 2, 3, 7, 1, 0]))
False
>>> cpr_check(np.array([0, 2, 0, 3, 9, 9, 3, 2, 1, 8]))
True
>>> cpr_check(np.array([3, 1, 0, 5, 0, 6, 5, 2, 8, 0]))
False
Problem 12.7: Node Divergence#
A graph can be represented as a 2D array where every row is a triplet \((i,j,w_{ij})\). Each triplet represents one edge from node \(i\) to node \(j\) with weight \(w_{ij}\). For example, the graph shown in the illustration and is represented by array \(A\).

The divergence of a node \(i\) is defined as
In other words, \(d_i\) is the difference between two sums: the sum of weights of all outgoing edges from \(i\), and the sum of weights of all incoming edges to \(i\).
For example
Write a function which takes a 2D NumPy array of shape (m, 3) representing a graph as input. The rows of the array represent graph edges as described above. The function should return a NumPy array where each row contains a pair: the node index and its divergence. Only the indices of nodes that are present in the graph should be included in the output, and indices in the first column should be sorted.
The expected behavior is shown below.
>>> import numpy as np
>>> A = np.array([[2, 7, 1],
...             [2, 1, 1],
...             [5, 1, 2],
...             [5, 7, 0.5],
...             [7, 2, 2.5],
...             [7, 5, 1],
...             [7, 8, 4],
...             [9, 7, 1],
...             [8, 9, 4]])
>>> node_divergence(A)
array([[ 1. , -3. ],
       [ 2. , -0.5],
       [ 5. ,  1.5],
       [ 7. ,  5. ],
       [ 8. ,  0. ],
       [ 9. , -3. ]])
The function requirements are:
node_divergence.pynode_divergence(A)
Compute the divergence of each node in the graph.
Parameters:
|
|
2D array with rows representing graph edges. |
Returns:
|
2D array with nodes and their divergences in rows. |
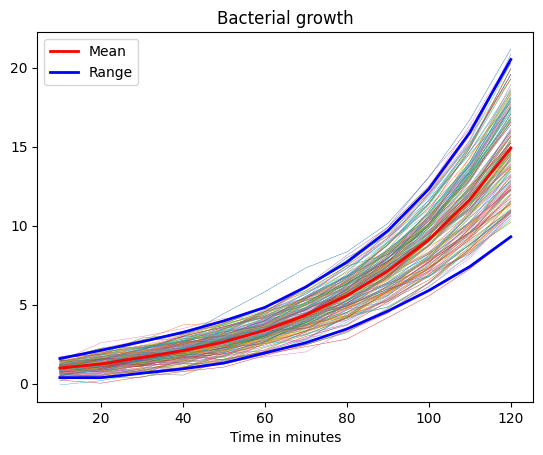
Problem 12.8: Growth Curve of Bacteria#
Download the file bacteria.npy.
The file contains the result of 160 experiments, where the bacteria growth was measured every 10 minutes for a total of 120 minutes.
Place the file in your current working directory. If you are unsure what your current working directory is, you can go back to Prep 9.1: Current Working Directory (CWD).
Load the data in the file using
data = np.load('bacteria.npy').
Each row, data[i,:], records the bacterial growth for one experiment.
Each column data[:,j] shows the bacterial growth for all 160 experiments at the \(j\)’th measurement time.
Calculate the mean \(\mu\) and standard deviation \(\sigma\) of the bacterial growth at each time step. You can find the mean and standard deviation of a Numpy array with np.mean() and np.std().
Calculate lower and upper range at each time step as \(\text{r}_\mathrm{lower} = \mu - 2\sigma\) and \(\text{r}_\mathrm{upper} = \mu + 2\sigma\).
Plot the bacterial growth from all the experiments in the same plot using a for-loop. The horizontal axis should have the label Time in minutes.
In the same plot, plot the mean bacterial growth, and the lower and upper range, using different colors and linestyles.
Change the plot options so that the plot looks like the one shown below.
Plot tips
You can change how each line looks in the plot, by specifying arguments in the plt.plot function. For example plt.plot(..., linewidth=0.3) and plt.plot(..., color='blue'), where the ... should be replaced by what you want to plot.
You can add specific entries to the legend (the box in the top-left corner), by specifying plt.plot(..., label='Mean). You can then add the legend using plt.legend().
Problem 12.9: Flowering Plants#
The information about the flowering season for the plants in a tropical greenhouse is stored in an \(n \times 2\) matrix of integer numbers between 0 and 12. Each row in this matrix is a pair of numbers representing one plant. The first number is a month of the year where the plant starts flowering and the second number is a month where the plant stops flowering. For example a pair \((11, 2)\) represent a plant with flowering season starting in November (month 11) and ending in February (month 2). If a plant flowers all year round, it is represented with \((0, 0)\). A plant represented with \((7, 7)\) has a short flowering season which both starts and ends in July.
Create a function flowering_plants which takes as input a 2D NumPy array (a matrix) of greenhouse plants \(G\), and a month \(m\) given by a number between \(1\) and \(12\). The function should return the total number of plants which flower in month \(m\). Plants which start or stop flowering in the month \(m\) should be counted as flowering in month \(m\).
flowering_plants.pyflowering_plants(G, m)
Compute the number of plants flowering in month m.
Parameters:
|
|
A NumPy array of shape (n, 2) of numbers between 0 and 12 representing a flowering season of plants. |
|
|
Integer between 1 and 12 representing a month. |
Returns:
|
Number of plants flowering in the given month. |
As an example, consider the input
The first plant has a flowering season represented by \((5, 9)\), which corresponds to months 5, 6, 7, 8, and 9, so this plant flowers in June. The second plant is represented by \((9, 11)\), which corresponds to months 9, 10, and 11, so it does not flower in June. The third plant is \((12, 6)\), corresponding to months 12, 1, 2, 3, 4, 5, and 6, so it flowers in June. The last plant is \((0, 0)\), and it flowers all year round, also in June.
In total, there are 3 plants flowering in June. The function should return \(\mathbf{3}\).
Problem 12.10: Checkerboard Sum #
Given a 2D NumPy array, we want to compute the sum of all elements occurring in a checkerboard pattern of arbitrary size. The square in the first row and the first column is always black.
Write a function which takes as input a 2D NumPy array. The function should return the sum of all elements in the black squares of the checkerboard pattern.
Consider the 2D NumPy array below.
import numpy as np
A = np.array([[ 1.42,  4.0,  55.56, 63.0],
              [ 2.22,  2.22, 33.73, 40.11],
              [12.1,  17.24, 18.0,  33.5],
              [21.15, 14.76, 17.3,  22.1],
              [ 5.34,  6.0,   9.8,   8.18]])
Arranged in a checkerboard pattern the array looks like this:

The sum of all elements occurring in a checkerboard pattern on the black squares is
and this is what your function should return, as seen below.
>>> checkerboard_sum(A)
np.float64(181.41)
The filename and requirements are in the box below:
checkerboard_sum.pycheckerboard_sum(A)
Return checkerboard sum.
Parameters:
|
|
A 2D NumPy array. |
Returns:
|
The sum of elements in checkerboard pattern. |
Use the following script to check your function test_checkerboard_sum.py. If your function fails the test in this script, it will also fail when you hand it in.
Problem 12.11: Robust Values #
Given a NumPy array of numbers, we want find the values which are not more than one standard deviation away from the mean.
Given \(N\) numbers \(x_i\), the mean and the standard deviation are
The robust values (that we want to keep) are less than exactly one standard deviation away from the mean, i.e. a robust value \(x_i\) satisfies \(\mu -\sigma \leq x_i\) and \(x_i \leq \mu + \sigma\).
Write a function which takes as input a NumPy array. The function should return a NumPy array containing only the robust values in the same order as in the original array.
As an example, consider the input below.
>>> import numpy as np
>>> x = np.array([41.42, 44.32, 45.56, 63.01, 12.22, 42.82, 43.73, 40.11])
The mean of the numbers is \(\mu = 41.65\), and the standard deviation is \(\sigma = 13.00\) (all values are here displayed with two decimals). The robust values are in the interval \([28.64, 54.65]\), so only values \(63.01\) and \(12.22\) should be removed, as seen in the code cell below.
>>> robust_values(x)
array([41.42, 44.32, 45.56, 42.82, 43.73, 40.11])
The filename and requirements are in the box below:
robust_values.pyrobust_values(x)
Return values within one standard deviation from the mean of the input.
Parameters:
|
|
A NumPy array. |
Returns:
|
A NumPy array with robust values. |
Use the following script to check your function test_robust_values.py. If your function fails the test in this script, it will also fail when you hand it in.